Written by Opus, reviewed and edited by me.
TL;DR: I built a minimal Qwen3-0.6B in pure PyTorch that runs on Apple Silicon, with a live chat UI that shows KV cache memory and per-token latency side by side. Toggle the cache off and watch attention compute go quadratic in real time. Code: github.com/ricklamers/kvcache-exploration.
I kept reading explanations of KV cache that all said roughly the same thing: it trades memory for compute, stores keys and values from prior tokens so attention doesn’t redo O(n²) work each step, makes decoding fast. I’ve heard it, you’ve heard it. But “KV cache saves time” is pedagogically thin. It doesn’t tell you how much time, at what memory cost, or what happens when you just don’t have one.
So I built a thing that makes the trade-off visible. A minimal Qwen3-0.6B in pure PyTorch running on Apple Silicon, wrapped in a live chat UI with a real-time memory chart and per-token latency line. There’s a toggle that turns the KV cache off. Flip it, send a prompt, and watch the per-token latency climb.
Here’s the conceptual picture for what happens per decode step:
cache ON (1 new token):               cache OFF (re-prefill N tokens):

    Q (1×D) ──┐                           Q (N×D) ──┐
              ×  ──► attn (1×N)                     ×  ──► attn (N×N)
    K (N×D) ──┘                           K (N×D) ──┘

  work ~ O(N)  per step                 work ~ O(N²) per step
  total ~ O(N²) for N tokens            total ~ O(N³) for N tokens
Cache on, attention compute per decode step is linear in the context length. Cache off, it’s quadratic. Over N generated tokens that’s the difference between a quadratic and a cubic total cost, and it’s what you see bend upward on the screen.
The demo
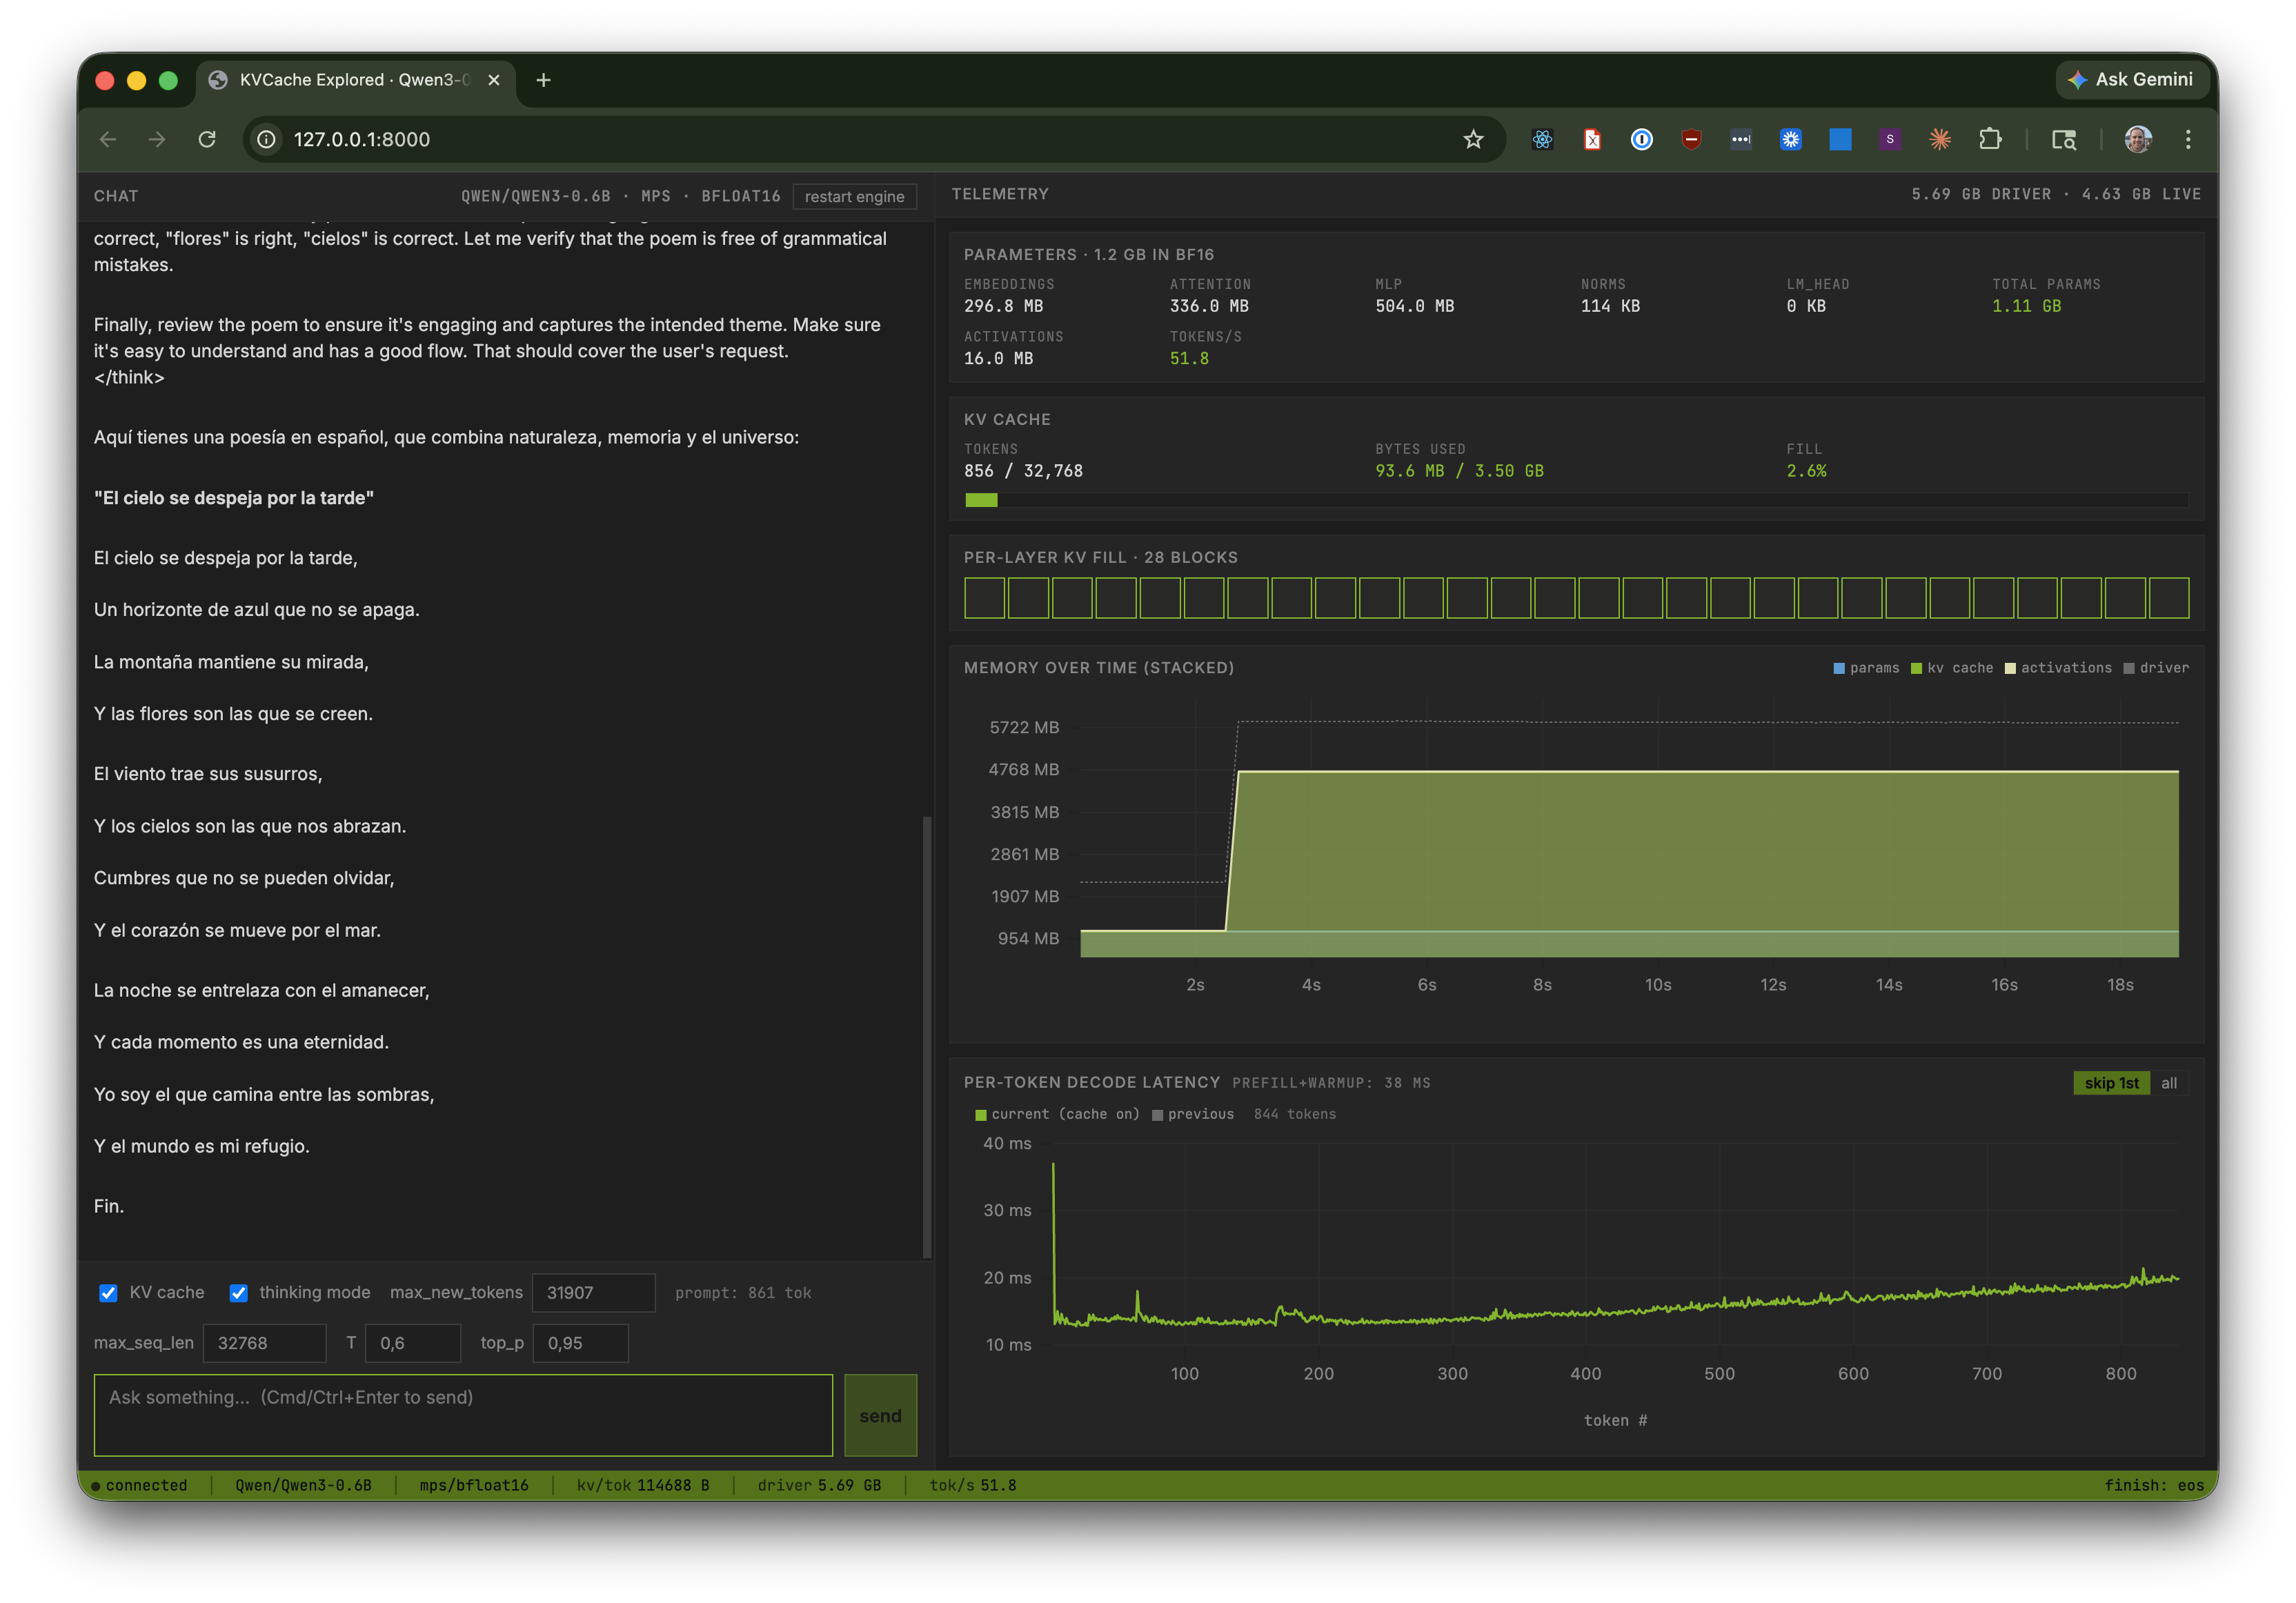
With KV cache on: memory gets a fat green band (the pre-allocated cache), and per-token latency is a flat line around 15 ms.
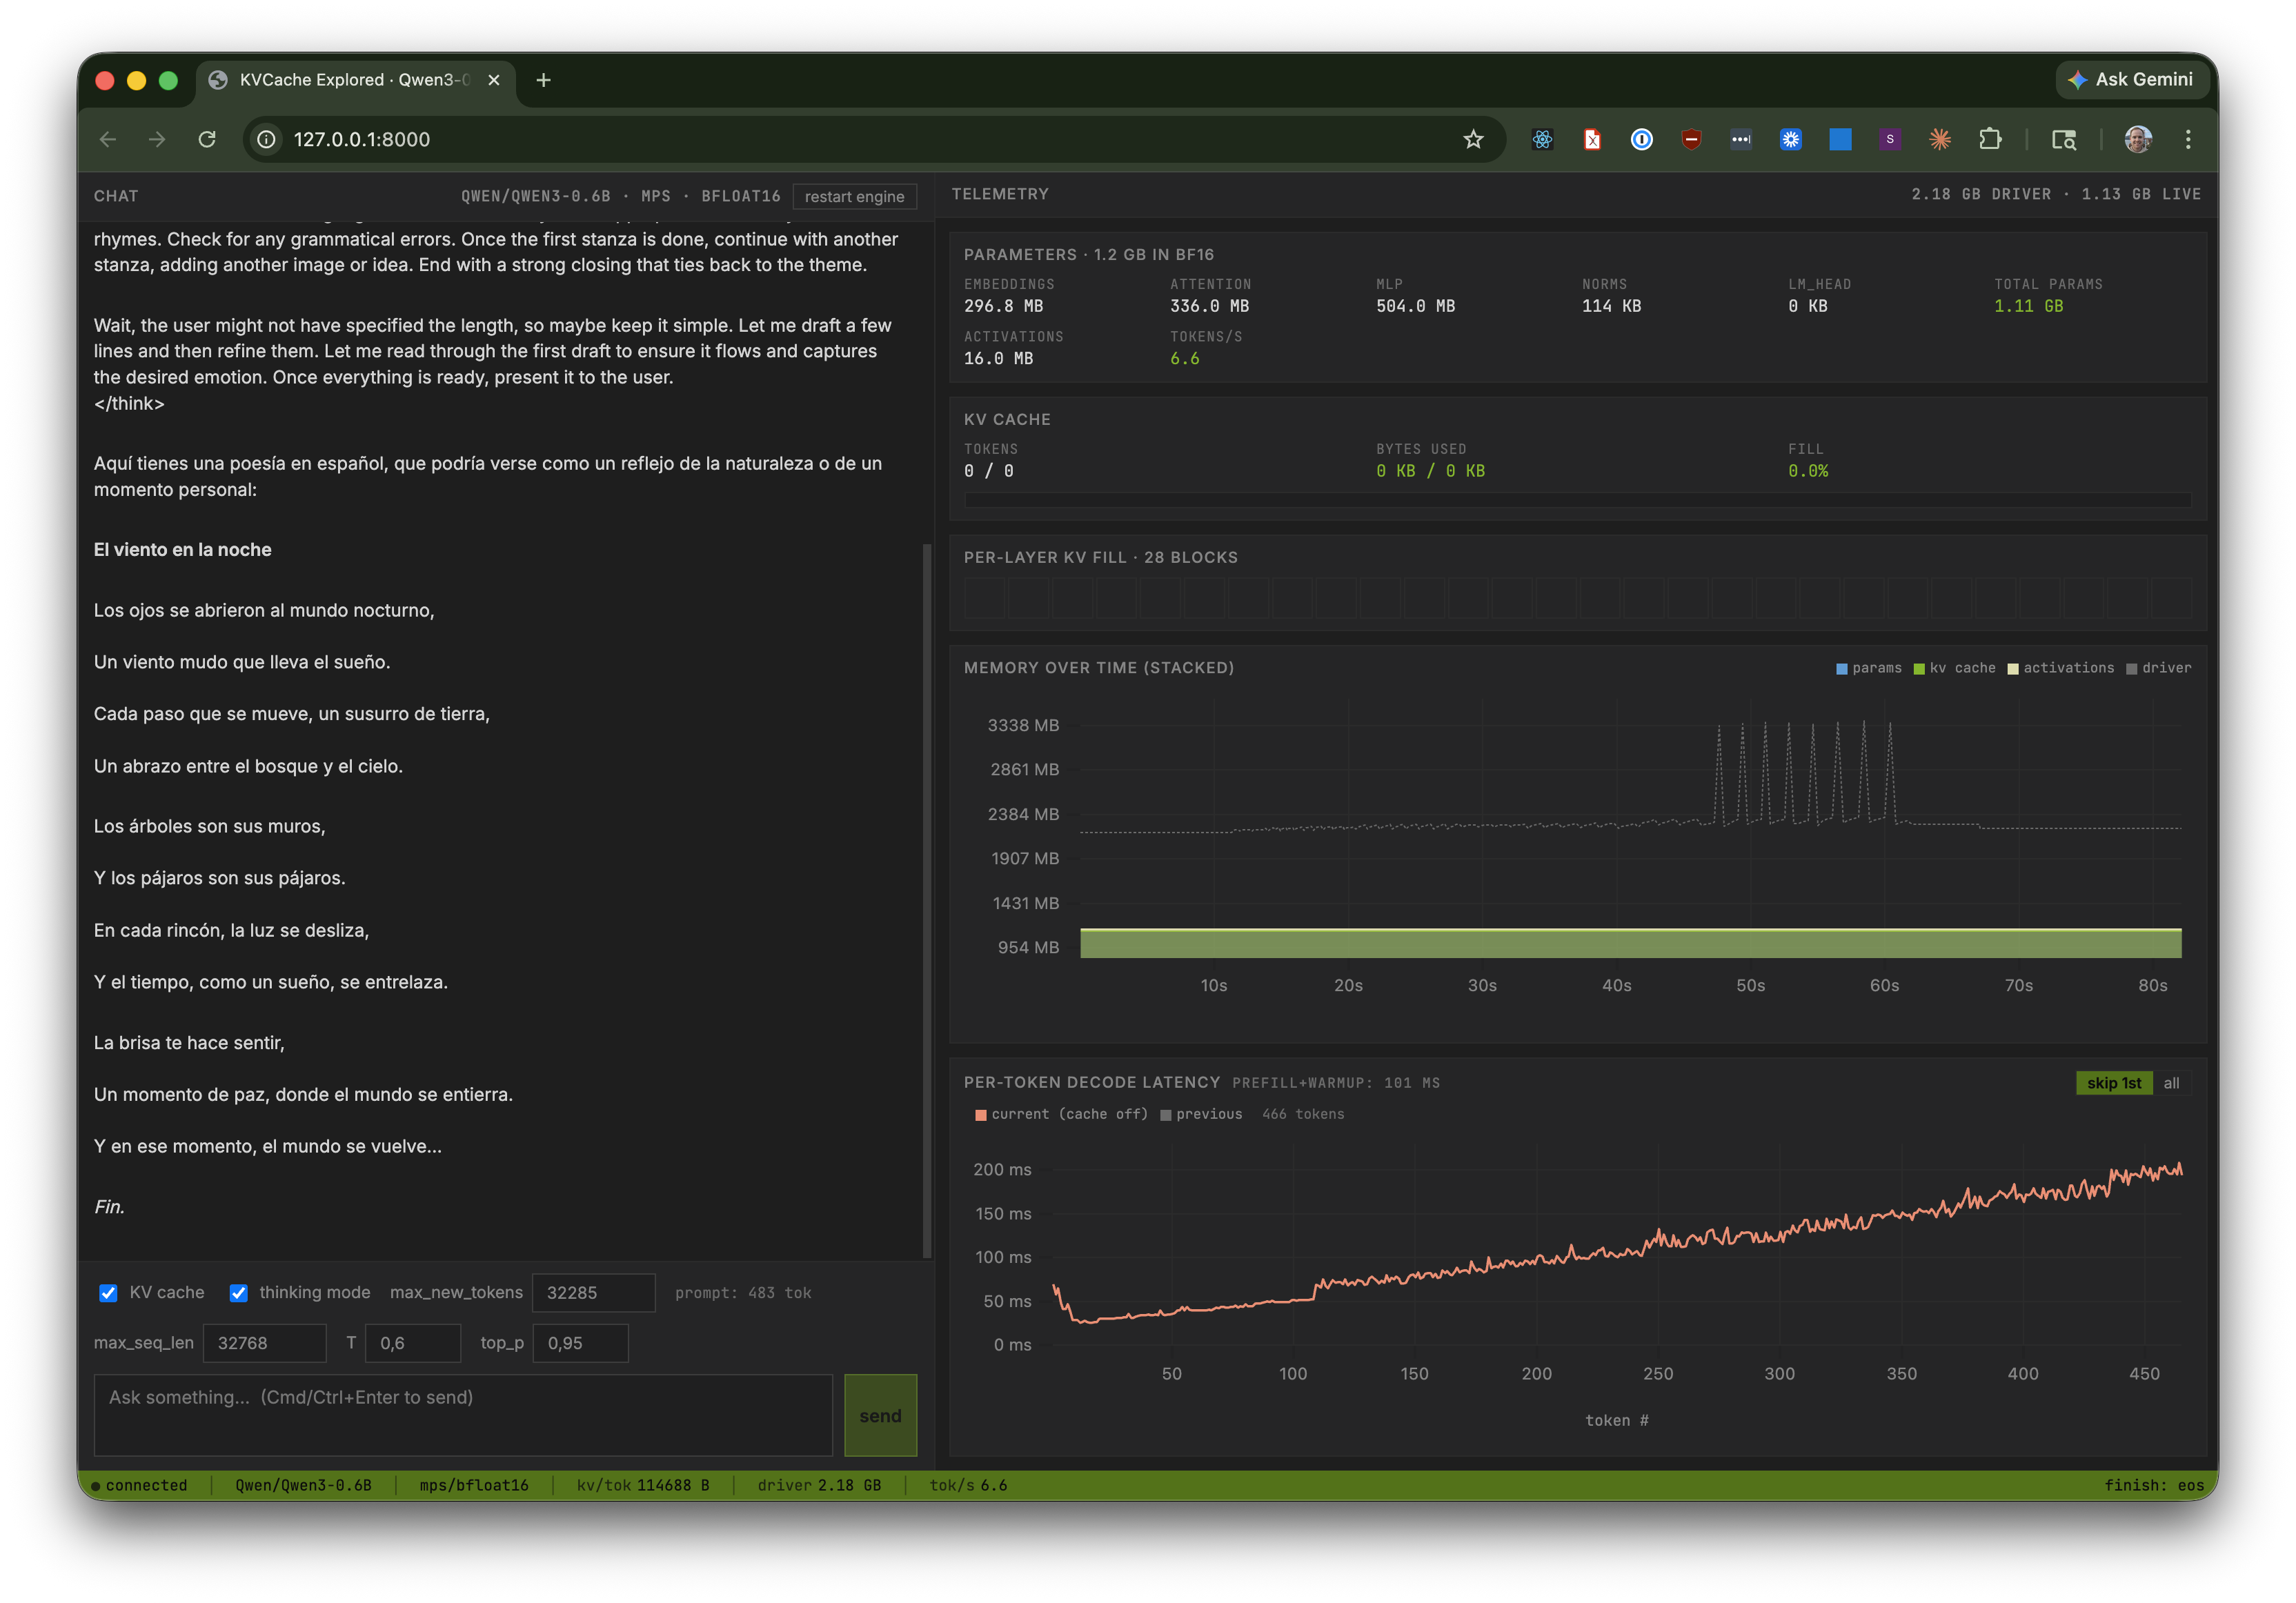
With KV cache off: the green band disappears, and the per-token latency chart starts near 50 ms and climbs past 150 ms as the sequence grows. That upward slope is the quadratic scaling of attention compute over a growing prefix.
Sketched side by side:
  per-token latency (ms)

       │                        .-'
   150 │                    _.-'
       │                _.-'
   100 │            .-'                         ◄── cache OFF
       │        .-'                                  (rises with seq_len)
    50 │    .-'
       │─────────────────────────────────────── ◄── cache ON
    15 │                                             (flat ~15 ms)
       └──────────────────────────────────────────►
                       token # →
KV cache trades linear memory growth for flat per-token time. Without it, memory stays lean but each step pays the full quadratic cost of recomputing attention over the whole prefix.
What’s in the box
- Qwen3-0.6B in ~300 lines of PyTorch, reading top to bottom like a tutorial (
src/kvcache_explored/model.py). RMSNorm, GQA attention with Qwen3’s specific QK-norm twist, RoPE (θ=1,000,000), SwiGLU MLP, tied embeddings, pre-norm residual blocks. - Apple Silicon via MPS in bf16: the model’s native precision. No quantization, no fp16 downgrade, nothing clever. It just works on any M-series Mac.
- Hugging Face
transformersas a continuous oracle. HF stays installed and we compare our logits against it on every change. Not a one-shot sanity check, a permanent verifier. - A Vite + React frontend with uPlot charts, a VS Code / Cursor-styled dark theme, live WebSocket streams for both tokens and memory telemetry, and a KV cache on/off toggle.
The verifier lives in scripts/verify_against_hf.py:
$ uv run python scripts/verify_against_hf.py
[OK ] empty           max|Δlogit|=0.0000  top5==  rollout==
[OK ] single-token    max|Δlogit|=0.0000  top5==  rollout==
[OK ] short-ascii     max|Δlogit|=0.0000  top5==  rollout==
[OK ] cjk-emoji       max|Δlogit|=0.0000  top5==  rollout==
[OK ] longer          max|Δlogit|=0.0000  top5==  rollout==

[verify] KV cache: per-step logit comparison (bf16 tolerance atol=1.0)
[OK ] empty           worst max|Δlogit|=0.2500 at step14  (budget 1.0)
[OK ] cjk-emoji       worst max|Δlogit|=0.3750 at step6   (budget 1.0)
[OK ] longer          worst max|Δlogit|=0.7031 at step4   (budget 1.0)

[verify] chat template: ours vs tokenizer.apply_chat_template
[OK ] user-only-nonthink      identical (78 chars)
[OK ] multi-turn-think        identical (125 chars)

[verify] all checks OK
max|Δlogit|=0.0000 means bitwise logit parity with HF on the last-token prediction across all five suite prompts. The KV cache path is separately checked against the no-cache path at the logit level with a bf16-aware tolerance, and the Jinja-rendered chat prompt is compared byte-for-byte with tokenizer.apply_chat_template(...).
Key files
src/kvcache_explored/
  model.py           Qwen3-0.6B from scratch (see class layout below)
  weights.py         HF safetensors → our state_dict loader
  kvcache.py         pre-allocated K/V tensors, one slot per layer
  generate.py        prefill + decode loops, with and without cache
  sampling.py        top-k / top-p / min-p / temperature
  chat_template.py   thin Jinja wrapper (template file sits next to it)
  memory.py          static param breakdown + live MPS counters
  engine.py          InferenceEngine (model + tokenizer + asyncio lock)
  server.py          FastAPI + /ws/chat + /ws/telemetry + /api/*
scripts/
  verify_against_hf.py   the continuous HF oracle
  demo_quadratic.py      CLI demo of cache-on vs cache-off per-token cost
  memory_report.py       CLI memory breakdown
web/                 Vite + React + TypeScript frontend
model.py is laid out top-to-bottom in the order the forward pass uses its pieces:
model.py

  Qwen3Config              frozen dataclass of architecture constants

  RMSNorm                  nn.Module, used by QK-norm and pre-norm

  build_rope_cache()       precompute (cos, sin) tables once per model
  apply_rope(q, k, ...)    rotate Q and K in-place

  Attention                grouped-query attention (16 Q heads, 8 KV heads)
                           with Qwen3 QK-norm applied before RoPE
                           accepts optional KVCache for cache-on path

  MLP                      SwiGLU: down(silu(gate(x)) * up(x))

  Block                    pre-norm residual: attn → add → mlp → add

  Qwen3ForCausalLM         embed_tokens → [Block] × 28 → norm → lm_head
                           forward() is wrapped in torch.inference_mode()
                           so no caller can accidentally build a grad graph
The memory story
Qwen3-0.6B weighs ~1.14 GB in bf16. Its native context is 32,768 tokens. A bf16 KV cache sized for that full context works out to:
bytes_per_token = 2 (K+V) × 28 layers × 8 KV heads × 128 head_dim × 2 bytes
                = 114,688 bytes ≈ 112 KB

kv_cache_32k    = 112 KB × 32,768 ≈ 3.58 GB
Stacked against the weights:
    GB 0   1   2   3   4   5
       ├───┼───┼───┼───┼───┤
weights│███                │  1.14 GB
  kv32k│███████████████    │  3.58 GB  ◄── 3× the model itself
The cache at full context is 3× the model weights. That ratio is the whole point of the memory chart.
It also explains the shape of every real inference server. vLLM, TRT-LLM, SGLang: their central design problem is KV cache management, not attention kernels. For Qwen3-32B at 128k the cache is tens of GB; paging it, quantizing it, sharing prefixes across requests, that’s half of what an LLM server does.
And structurally, the cache isn’t one buffer; it’s 28 independent buffers, one per transformer block, because attention at block i can only use the K/V that block produced:
layer  0  [████████░░░░░░░░░░░░░░░░]   each layer writes
layer  1  [████████░░░░░░░░░░░░░░░░]   its own K/V here
layer  2  [████████░░░░░░░░░░░░░░░░]
   ...
layer 27  [████████░░░░░░░░░░░░░░░░]
           └filled┘└──── free ────┘
Doubling the model’s depth doubles the cache. Doubling the heads doubles the cache. Doubling the context length doubles the cache. Nothing about KV cache memory cost is incidental; it’s all in the numbers above.
The thing I like most about this project
It’s single-user, single-GPU, single-file-per-concept. The model is one file. The KV cache is one file. The generator is one file. The Jinja chat template lives in its own .jinja file, copied verbatim from the tokenizer config. There are no abstract base classes, no registries, no config dataclasses with 40 fields, just the shapes that Qwen3-0.6B actually uses.
When you’re learning something, the right level of abstraction is “none.” Every layer of indirection between you and the math is a layer you have to reverse-engineer before the ideas land. A production inference server is a marvel of engineering, but it’s a terrible place to learn what a KV cache is. The right place is 200 lines of PyTorch where you can see every tensor shape.
Try it
git clone https://github.com/ricklamers/kvcache-exploration
cd kvcache-exploration
uv sync
uv run python scripts/verify_against_hf.py   # ~5 prompts, should all be OK
(cd web && npm install && npm run build)
uv run uvicorn kvcache_explored.server:app --host 127.0.0.1 --port 8000
# → http://127.0.0.1:8000
Send a medium-length prompt with KV cache on, watch the latency chart be flat. Then hit restart engine, toggle KV cache off, send the same prompt, and watch the latency climb. Both runs share the same chart, so the comparison is right there in front of you.
The Python code is ~2000 lines. All of it is meant to be read.